ECONOMICS 101:
Federal Debt
Every family and every business must balance a budget. Corporations, charities, local governments and school boards all balance a budget. Yet somehow when it comes to our representatives in Washington D.C. for most of a century they refuse to abide by any spending limits. The United States now owes $35 trillion and counting – with taxpayers on the hook for a $1 trillion annual interest payment. The total debt is now greater than $100,000 per every U.S. citizen. How can the American voter tolerate this? Ignorance.
For many decades politicians have skillfully executed the “Moonwalking Bear” con on the American people. A barrage of politically motivated propaganda has concealed sensible examination of the federal budget. Who pays what? Is that your fair share? Should the upper income tax bracket be 37%, 39.6%, 28%, or 31%? While we all argue about microscopic adjustments to the revenue column, the ‘Moonwalking Bear’ of federal spending dances by without being noticed.
- MYTH: The rich do not pay a fair share of taxes
- MYTH: Republican tax cuts only benefit the rich
- MYTH: Tax cuts need to be 'paid' for
- MYTH: Corporate tax breaks equal welfare
- MYTH: Reagan|Bush|Trump tax cuts increased deficits
Instinctively many readers will not believe me. Where do I get this stuff? Here are links to the data:

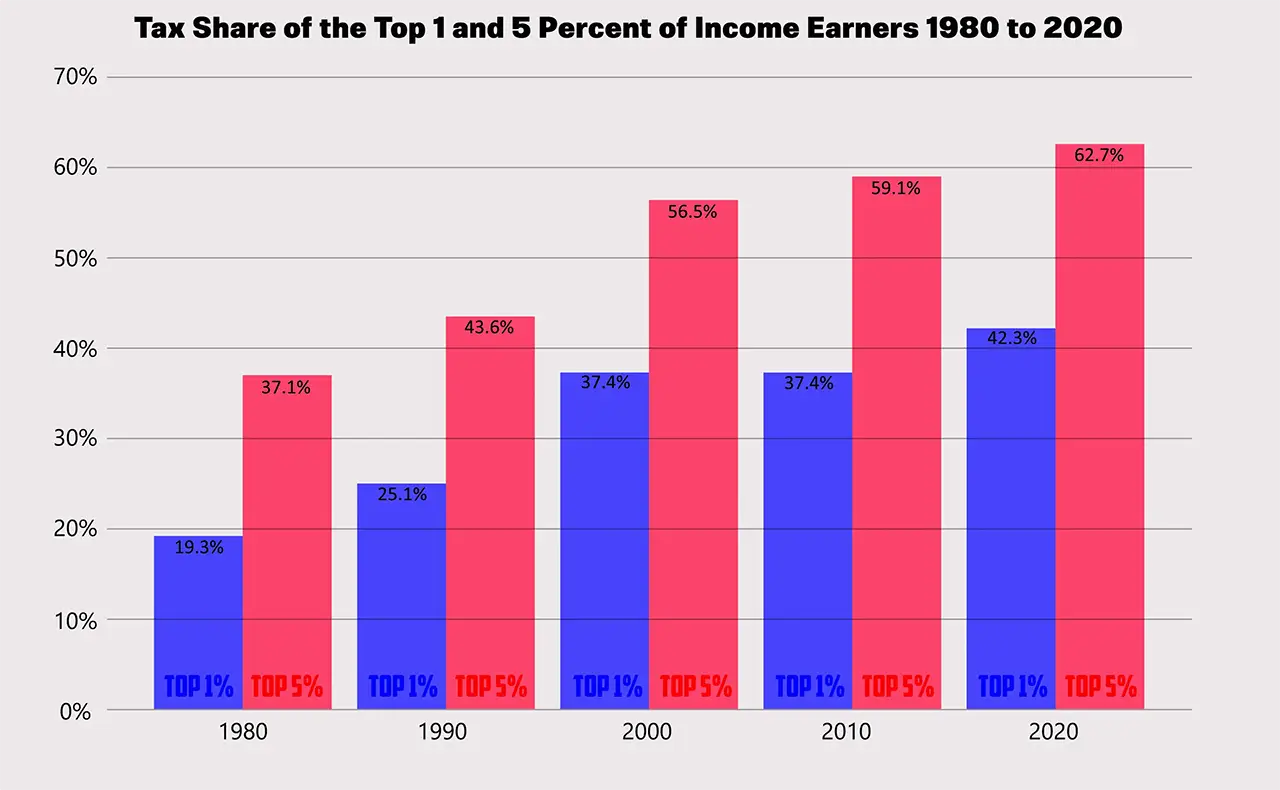
MYTH: The rich do not pay a fair share of taxes
COUNTERPOINT: You must include all the taxes people pay
Why FICA Taxes Are Irrelevant to the 'Fair Share' Conversation?
Social Security is an off-budget program. Any surplus in S.S. or Medicare are (officially) put toward the future of the program and not the current year's general budget. For that reason, completely irrelevant toward the 'fund the budget by making the rich pay a fair share' discussion.
If Democrats would like government mandated retirement contributions to be redistributed, they should be honest about it. Tell Americans the individual Social Security account funded every week since their eighteenth birthday can now be used to subsidize the retirement of others. All depending on whether, if by ones 63rd birthday, a taxpayer has earned annual income exceeding the Congressionally acceptable limit. Run on that. See how well it works.
Democrats have long considered themselves the 'protectors' of the FDR created Ponzi Scheme called Social Security. In a way that would make Bernie Madoff blush, Congress has spent every dollar of the money without investing a dime. The insolvent 'Social Security Trust Fund' is virtual reality. Existing on paper only. Yet every republican proposal to authenticate the program has been met with relentless democratic opposition to ensure preservation of the status quo.
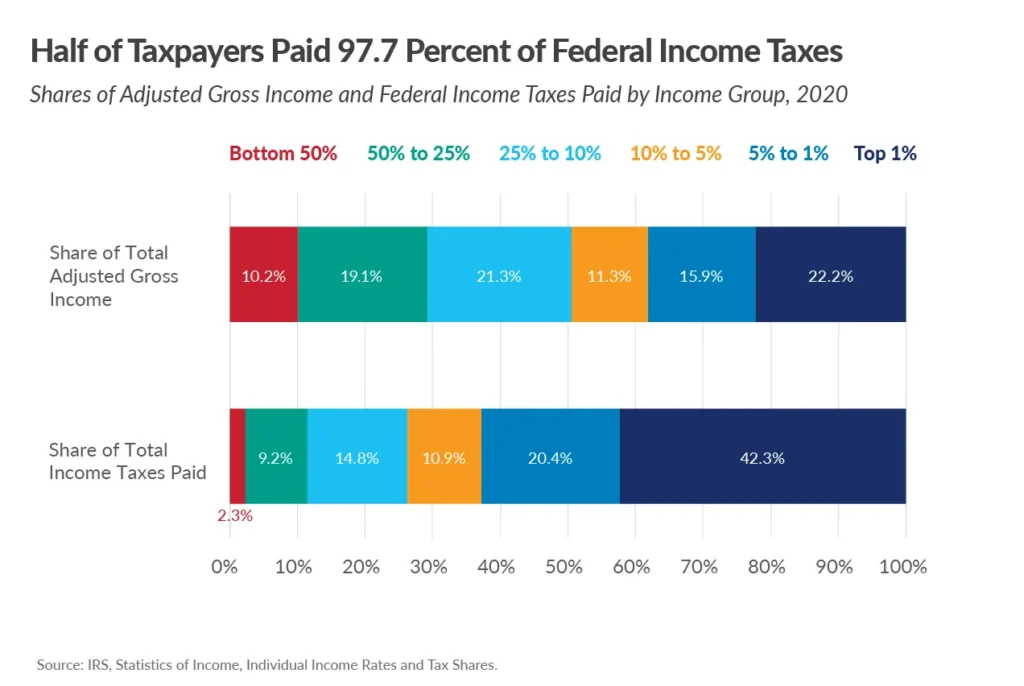
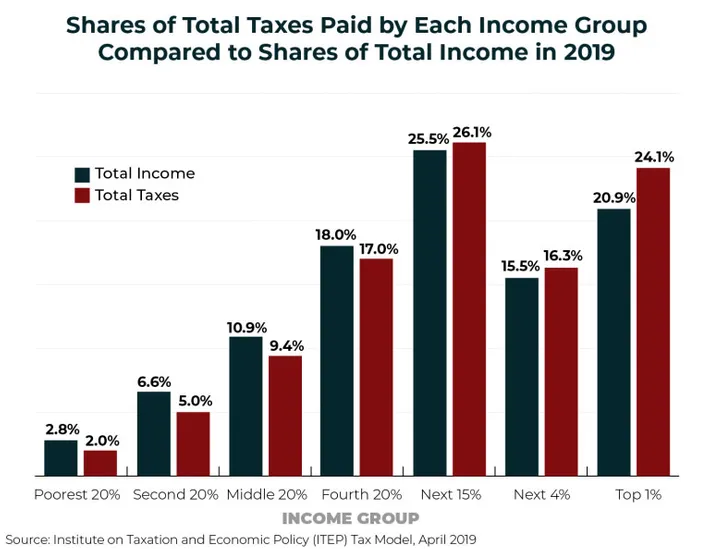
Even mixing FICA with income tax in a deceptive fashion to water down progressive taxation (Figure 2), the top 20% of income earners still pay more than a 'fair share' of taxes.

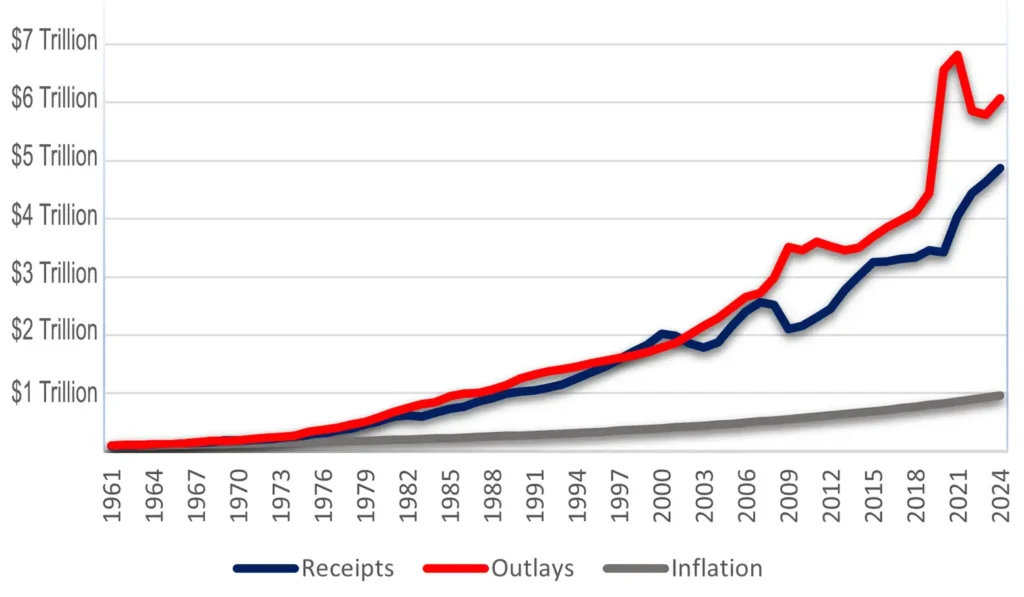
MYTH: If the rich paid a fair share, it would balance the budget
Federal revenues have grown an average of 6.56% per year over the last six decades. During that same time period inflation has averaged only 3.73%. Tax revenues are increasing at a fantastic rate. The problem? Congressional spending habits have multiplied at an even greater rate. The tune of 7.42% annual spending increase since 1961. The problem is obvious for anyone with eyes. The cause of the national debt is irresponsible Congressional spending. No wonder they want to deflect attention onto the 'one-percenters' or the 'millionaires and billionaires'.
The federal budget is used as a reelection slush fund for the 535 members of Congress. Every election cycle members return to their districts bragging about how much money they 'brought back' to your town. But it was never 'their' money, it is your money. Think about the logistics of our government system for a minute. We send our local money to the monstrosity of Washington D.C. and then elect legislators to chase after it. And if they succeed in getting your money back - the boasting begins.
| Decade | Annual Revenue Growth | Annul Spending Growth |
|---|---|---|
| 1930s | 5.0% | 11.9% |
| 1940s | 22.1% | 17.0% |
| 1950s | 6.5% | 5.7% |
| 1960s | 8.1% | 7.5% |
| 1970s | 10.2% | 11.1% |
| 1980s | 7.5% | 9.2% |
| 1990s | 6.5% | 5.7% |
| 2000s | 0.4% | 6.4% |
| 2010s | 5.4% | 2.8% |
| 2020(4) | 9.3% | 15.5% |