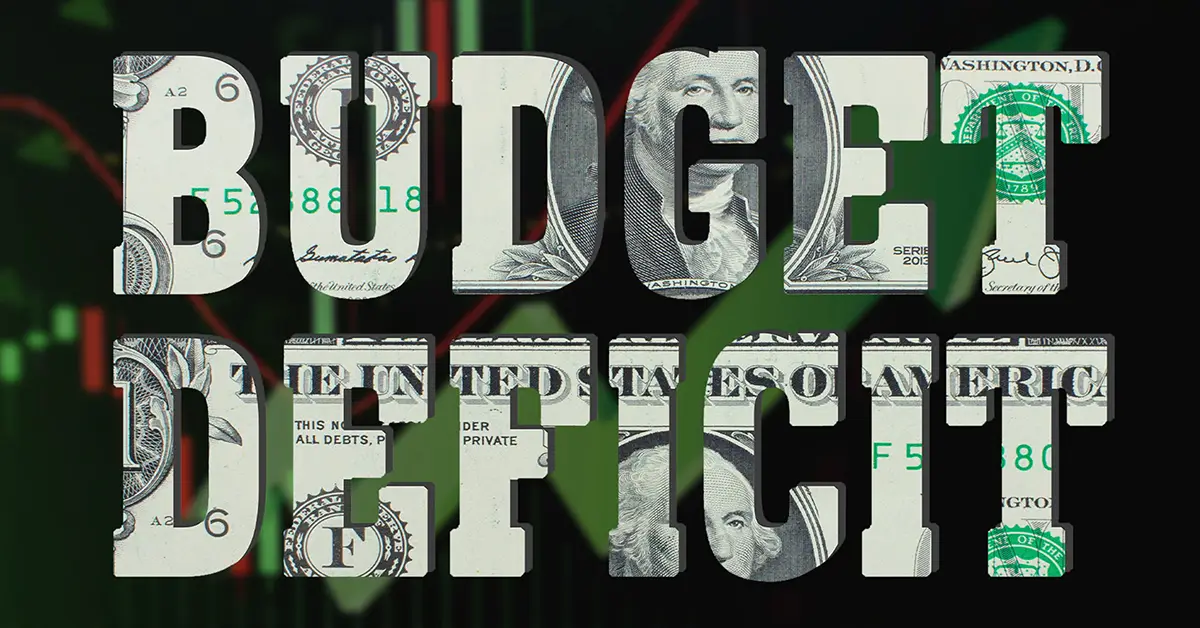
It’s the Spending, Stupid
by Darrin Barker January 28, 2024
Republicans always pass tax cuts for the rich without any plan to pay for them. There is an immoral duplicity to preaching about reducing the budget deficit on the stump – while simultaneously exploding the budget deficit to pay off your wealthy donors. Meanwhile, working Americans get nothing but scraps.
One could confidently estimate the vast majority of democrats would endorse the above statement. Yet it is easily debunked propaganda. The entire premise that tax cuts need to be 'paid for' is a left-wing inspired cliché. An old wives' tale so strongly etched into our American culture that those who question it are accused of disinformation. Movies, television, journalism, academia – anywhere you go in our society the above is incessantly repeated as fact. Yet just a basic analysis of yearly budget data completely disproves the premise.
Lowering individual tax percentages for the highest income earners does not reduce federal tax revenues. Let me repeat – as I suspect many readers may not believe this is accurate – taking fewer tax dollars from income earners does not ‘cost’ anything. There is no need to pay for something that is free.
How is that possible? When the government allows taxpayers to keep more of what they earn, it changes behavior. Additional disposable income inspires more travel and commerce, which then generates new streams of tax revenue. This is what ‘Trickle-Down-Economics’ means. I know. You have been told that it means giving more to the rich hoping it might trickle down to the middle class and poor. Nope. 'Trickle-Down' is allowing everyone to keep more of what they earn knowing much of it will trickle back down to the government via taxation. “The Decade of Greed” label for the 1980’s is also left-wing propaganda. Reagan tax cuts allowed families to spend more of the income they earned, rather than the federal government spending it for them. For the big-government leftists - making your own choices is arrogantly considered 'greed’. 'They' know better how to spend your money.
The proof is in this table below. Over the last 64 years revenue has grown at a pace of 6.56% per year. During this same time period annual inflation has only averaged 3.73%. Revenue grows by $1.75 for every dollar of inflation. Revenue is not an issue.
However, spending has increased at an annual rate of 7.42%. We have a glaringly obvious government spending problem. Even after dropping the highest tax bracket from 91% down to 28%, revenues continued to consistently grow. Since, we have gone back up to 39.6%, down to 35%, returned to 39.6%, before settling back down to 37%. Through it all revenue continued consistently growing far above inflation levels. It is all window dressing. Insignificant. There is no direct mathematical relationship between tax rates and federal revenue.
Federal Revenue Compared to Income Tax % Changes, 1961-2024
- recession
- tax cut
- tax increase
- revenue decrease
- spending decrease
| YEAR | income tax top rate | federal revenue ($millions) | federal spending ($millions) |
|---|---|---|---|
| 1961 | 91.0% | 94,388 | 97,723 |
| 1962 | 91.0% | 99,676 | 106,821 |
| 1963 | 91.0% | 106,560 | 111,316 |
| 1964 | 77.0% | 112,613 | 118,528 |
| 1965 | 70.0% | 116,817 | 118,228 |
| 1966 | 70.0% | 130,835 | 134,532 |
| 1967 | 70.0% | 148,822 | 157,464 |
| 1968 | 70.0% | 152,973 | 178,134 |
| 1969 | 70.0% | 186,882 | 183,640 |
| 1970 | 70.0% | 192,807 | 195,649 |
| 1971 | 70.0% | 187,139 | 210,172 |
| 1972 | 70.0% | 207,309 | 230,681 |
| 1973 | 70.0% | 230,799 | 245,707 |
| 1974 | 70.0% | 263,224 | 269,359 |
| 1975 | 70.0% | 279,090 | 332,332 |
| 1976 | 70.0% | 298,060 | 371,792 |
| 1977 | 70.0% | 355,559 | 409,218 |
| 1978 | 70.0% | 399,561 | 458,746 |
| 1979 | 70.0% | 463,302 | 504,028 |
| 1980 | 70.0% | 517,112 | 590,941 |
| 1981 | 70.0% | 599,272 | 678,241 |
| 1982 | 50.0% | 617,766 | 745,743 |
| 1983 | 50.0% | 600,562 | 808,364 |
| 1984 | 50.0% | 666,438 | 851,805 |
| 1985 | 50.0% | 734,037 | 946,344 |
| 1986 | 50.0% | 769,155 | 990,382 |
| 1987 | 38.5% | 854,287 | 1,004,017 |
| 1988 | 28.0% | 909,238 | 1,064,416 |
| 1989 | 28.0% | 991,104 | 1,143,743 |
| 1990 | 28.0% | 1,031,958 | 1,252,993 |
| 1991 | 31.0% | 1,054,988 | 1,324,226 |
| 1992 | 31.0% | 1,091,208 | 1,381,529 |
| YEAR | income tax top rate | federal revenue ($millions) | federal spending ($millions) |
|---|---|---|---|
| 1993 | 39.6% | 1,154,334 | 1,409,386 |
| 1994 | 39.6% | 1,258,566 | 1,461,752 |
| 1995 | 39.6% | 1,351,790 | 1,515,742 |
| 1996 | 39.6% | 1,453,053 | 1,560,484 |
| 1997 | 39.6% | 1,579,232 | 1,601,116 |
| 1998 | 39.6% | 1,721,728 | 1,652,458 |
| 1999 | 39.6% | 1,827,452 | 1,701,842 |
| 2000 | 39.6% | 2,025,191 | 1,788,950 |
| 2001 | 39.1% | 1,991,082 | 1,862,846 |
| 2002 | 38.6% | 1,853,136 | 2,010,894 |
| 2003 | 35.0% | 1,782,314 | 2,159,899 |
| 2004 | 35.0% | 1,880,114 | 2,292,841 |
| 2005 | 35.0% | 2,153,611 | 2,471,957 |
| 2006 | 35.0% | 2,406,869 | 2,655,050 |
| 2007 | 35.0% | 2,567,985 | 2,728,686 |
| 2008 | 35.0% | 2,523,991 | 2,982,544 |
| 2009 | 35.0% | 2,104,989 | 3,517,677 |
| 2010 | 35.0% | 2,162,706 | 3,457,079 |
| 2011 | 35.0% | 2,303,466 | 3,603,065 |
| 2012 | 35.0% | 2,449,990 | 3,526,563 |
| 2013 | 39.6% | 2,775,106 | 3,454,881 |
| 2014 | 39.6% | 3,021,491 | 3,506,284 |
| 2015 | 39.6% | 3,249,890 | 3,691,850 |
| 2016 | 39.6% | 3,267,965 | 3,852,615 |
| 2017 | 39.6% | 3,316,184 | 3,981,630 |
| 2018 | 37.0% | 3,329,907 | 4,109,045 |
| 2019 | 37.0% | 3,463,364 | 4,446,956 |
| 2020 | 37.0% | 3,421,164 | 6,553,603 |
| 2021 | 37.0% | 4,047,112 | 6,822,449 |
| 2022 | 37.0% | 4,436,626 | 5,851,576 |
| 2023 | 37.0% | 4,638,192 | 5,792,048 |
| 2024 | 37.0% | 4,874,415 | 6,075,220 |
To paraphrase the 1992 Clinton campaign slogan, (It’s the economy, stupid) It’s the spending, stupid. While inflation grows at 3.73%, and revenue increases by 6.56%, during that same time federal spending has grown by 7.42% per year. With that level of fiscal irresponsibility $50 trillion of federal debt is inevitable.
Looking at the data, revenue has only dropped in 8 of the last 64 years. In every single case either during or immediately following a recession. The only case where tax cuts coincide with a revenue decrease is 2001-2003. But the tax cuts could not have been the catalyst. The bulk of the tax cut did not take place until 2003. Yet the revenue drop began in 2001. The loss in federal revenues coincide with both the bursting dot-com bubble and the post 9/11 economic fallout. This drop, just like all of the others, is led by economic recession. Recessions cause tax revenue losses, not rate cuts.
Politicians quite intentionally concentrate on the revenue side of the deficit. Decades of partisan arguments dividing the parties over tiny 3% changes to income tax rates are the dancing bear. A distraction to take the public eye off of the spending column. The federal budget is how they buy votes. It is the number one selling point for Congressional reelection. Bragging about how much money YOU have brought back to the district for ‘project A’ and ‘infrastructure B’. The federal budget is used as a reelection slush fund for whichever party is in charge. Reducing this stockpile will never enter the list of political priorities.
If there were an economically educated public. If there were a curious media. If the Congressional Budget Office would just be honest, no republican would ever again be asked, "How do you plan to pay for your proposed tax cut plan?"